
Data Visualisations
Learning how to read and make data displays is an important aspect of data literacy. In this class, you will learn about interesting and creative ways to display data. Most of us are used to bar graphs and pie charts, but there are many more imaginative options too.
Preparation
Before you come to online class, please:
- Read pages 29-33 of the Teach Data Literacy Handbook about the progression of skills for reading graphs.
- Read this New York Times article about a technique for teaching children how to read graphs called What's Going on in This Graph.
- Pick a What's Going on in This Graph activity which looks interesting and try it yourself.
- Watch this video by Hans Rosling (a data rock star) - 5 minutes. It's a good example of a complex, interactive visualisation which is easy to read. You can try out the software he used in the video here.
Online class
Come to the online class on 20/3/24 at 7 - 9pm. We'll email you with the joining link.
Activity
After the class, try out one of these activities with your learners. You can choose from:
- Pick a Dear Data activity which you think would suit your learners.
- Try a What's Going on in This Graph or a Slow Reveal activity with your learners.
- Try out the ZeroWaste Data Physicalisation Kit from your kit box.
Try out an activity which you tried during the online class, or heard about from another teacher at the course
Note: You might also find it useful to browse this collection of data visualisation examples.
Reflection, feedback and sharing
Once you've tried out the activity with your learners, please do the following. There will also be a chance for feedback and sharing at the next class.
Reflective writing
Use the prompts to write a short post to help you reflect on how it went. It doesn’t need to be long (a few hundred words would be OK).
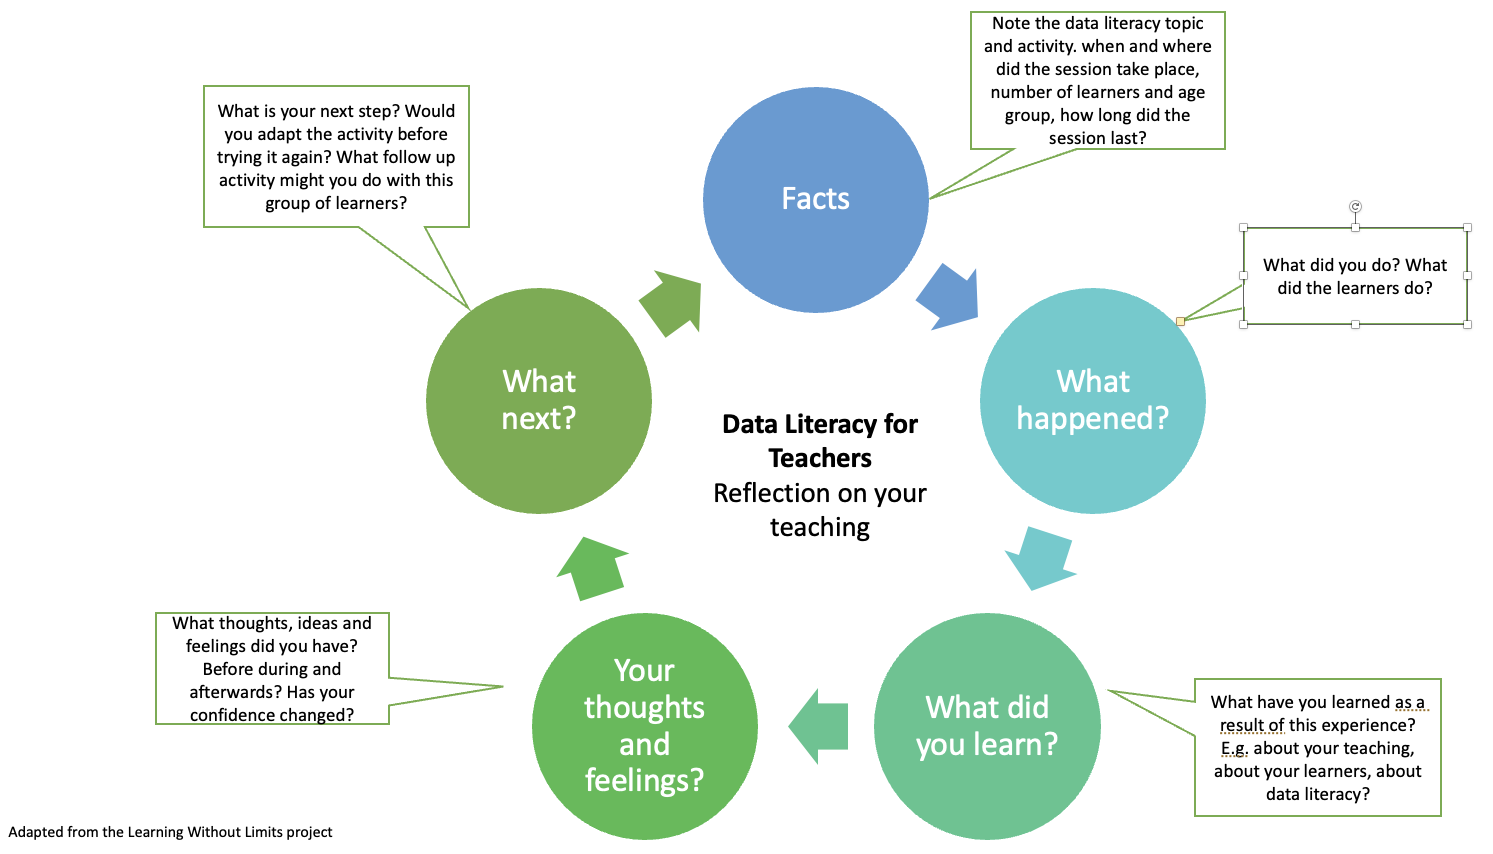
Facts: What was the topic and activity? Which learners took part, how many and what age group?
What happened? What did you do? What did the learners do? What did anyone else do?
What did you, as a teacher, learn? What have you learned as a result of this experience e.g. about teaching, your learners or about data literacy?
Your thoughts and feelings? What thoughts, ideas and feelings did you have before, during and after the session? Has your confidence changed as a result of teaching this activity?
What next? What is your next step? If you were to do this activity with another class, would you adapt it? What follow-up activity might you do with this class?
Feedback
Read the posts by two other members of the course and give them feedback.
Share
Tell another teacher at your school about what you have been working on.